

Production & Losses
Highly accurate measurement of your power generation
GreenStream™ gives you |Highly accurate measurement of your power generation | Detailed explanation of your time and energy losses |Contractual availability and dispatch down reporting |Financial tracking of business revenue against budget |
Production and Performance
Power production is displayed at portfolio, plant, inverter and string box level (and further granularity as required / available).
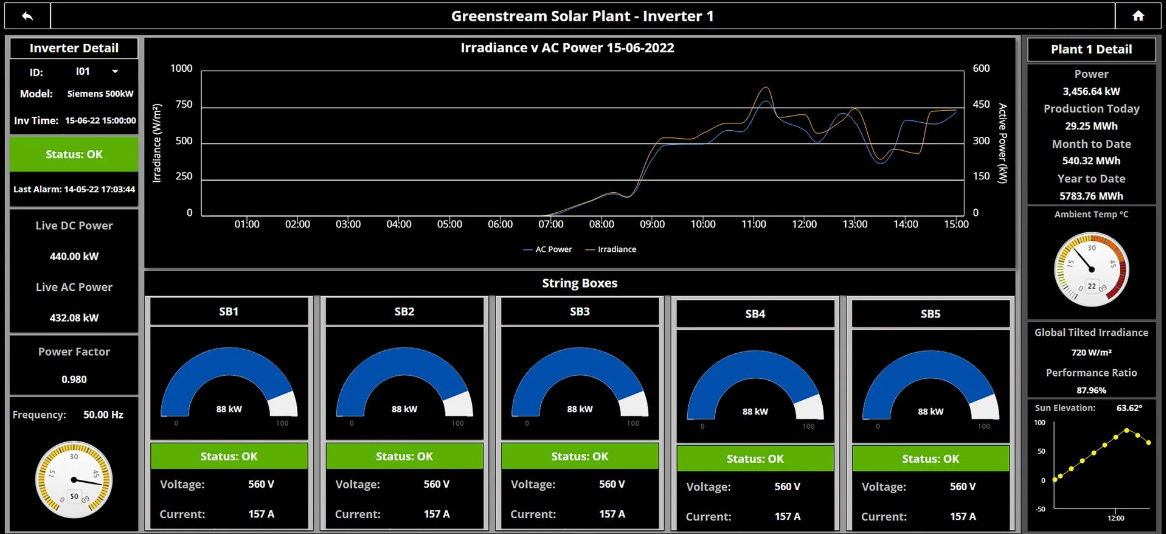
- Inverter dashboard – power production, voltage and current, meteorological and solar inclination data, inverter status, string box status - power, voltage and current
- Solar plant performance dashboard - financial performance, production performance and KPIs including performance ratio, operational availability % and contractual availability %
- Portfolio dashboard – aggregated view of generation mix, production and efficiency
- A map view of your portfolio
Inverter Status Overview
A dashboard of the current state of every inverter on your solar plant in a single view.
Production Losses
Production losses are tracked on a time basis, including Grid down hours, Fault down hours and Environment down hours, to give an overall operational availability.
Contractual Availability
Contract availability is calculated on an energy basis and measures lost production due to equipment faults, repair and scheduled maintenance. Where availability is less than the contractual availability, compensation is calculated as per the supply agreement.
Business Performance
GreenStream™ tracks and reports on revenue against budget throughout the financial year, at portfolio level and solar plant level. For power generators operating under subsidy / tariff schemes, subsidy / tariff based revenues can be calculated. GreenStream™ provides information to your financial systems for reporting and analysis.
Ready to Find Out More?